As a Geographer, GIS guru, and Weather nerd, I’m often asked: “Why do we need more maps? Haven’t all the maps been made by now?” With all the mapping tools available to us on a daily basis now (SmartPhone apps, Google Maps, etc.) it can seem at times that mapping is as easy as plotting pushpins on a Google or Bing map. Analysis of such topics as severe weather seems almost immediate, and as easy, as simple tapping an icon and getting the exact summary information one needs. With voice recognition, it almost seems like Star Trek “Computer, .. tell me the chance of rain in Topeka at 9:02 PM Tuesday…”
What we know of course, is that a whole lotta work and planning goes into those pretty pictures we see on our phone or website. The current coverage of the severe weather outbreak in the central United States illustrates the scope and importance of ongoing data collection, and investment in GIS and related technologies. Weather prediction is hard enough in itself, and producing short term warnings and predictions during storm events requires a GIS based infrastructure be in place, tested, and updated regularly.

GIS data is all around us.
Most of us, contrary to what we say, trust and depend on the weather forecasts we see on TV, the Web, and most especially on our phones. We plan and run our lives based on this information, daily. For the most part, most people have no idea where the data comes from, or how it is used to create the “quicky” forecasts on which we all depend. There are many commercial weather sources, apps, and local outlets packaging the weather data in ever changing and creative ways. Still, MOST of the underlying data for these products is collected by the National Weather Service (NWS), an agency of NOAA, and the US Department of Commerce. This can only be provided due to a long term, decades long commitment to data collection, development of atmospheric models, and training of Meterologists, Climatologists, and Atmospheric Scientists. This has been done quietly, and consistently by the NWS and academic institutions for many decades, and it forms the backbone of weather forecasting and planning on which we all depend.
Here is today’s Convective Outlook, indicating areas of possible severe storm/Tornado formation:

GIS is a BIG key to all this:
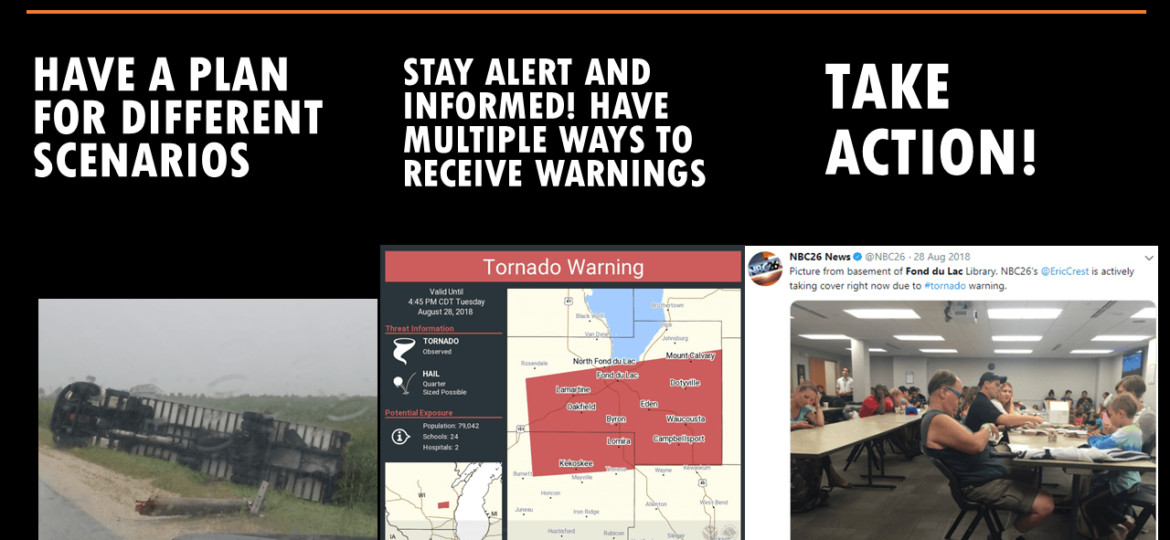
GIS (Geographic Information Systems) is the set of geographic and data management tools that make all that data useful, in a variety of ways. All the radar overlays, nice base maps showing topography and freeways, shading to indicate warning areas and tornado alerts; they are all the result of GIS. In the case of the National Weather Service, it means a sophisticated, long developed system of GIS experts, powerful computers, and custom mathematical models, funded by public money, for the public good.
However, there are many other ways you can benefit from GIS at a smaller scale. See an upcoming blog for some great ideas and opportunities to use GIS for your business or organization.
Here are a few links for use in tracking the current tornado events, and other weather related information.
Stay safe out there! Listen to NOAA Weather Radio if you are in a tornado prone area.
NOAA Weather Radio: https://www.nws.noaa.gov/nwr/
Storm Prediction Center: https://www.spc.noaa.gov/
NWS GIS Data Portal (for GIS users): https://www.weather.gov/gis/
Cliff Mass Weather and Climate Blog: https://cliffmass.blogspot.com/
(Atmospheric Scientist at the University of Washington, Seattle, WA)
For more information: Contact Tom, at Synthos, LLC: 206-406-5246