This was an interesting project for me, working with colleagues at NOAA. Authors: John Lindsay, Tom Simon, and George Graettinger
Application of GIS technology to support Remediation of Petroleum Contaminated Soils on the Pribilof Islands, Alaska
Introduction
A Geographic Information System (GIS) project is being compiled within NOAA’s Office of Response and Restoration (OR&R) to identify Global Offshore Hazardous Materials Sites (GOHMS), and sites on remote islands that potentially threaten sensitive marine habitats and species. The project applies Range Continuum of Resolution (RCR) techniques (Lindsay et al., 1998a,b) to move the user from a geo-referenced global perspective to fine scale site specific boundaries and sampling locations. Vector graphic project views acquired from existing base maps, aerial/satellite photography, and differential geographic positioning systems (DGPS) are enhanced with digital imagery acquired from a suite of nested advanced technologies. The GOHMS project presently depicts more than 250 sites worldwide.
Remote islands and their nearshore shallow waters represent another set of environmental problems that present logistical problems similar to those posed by offshore waste sites. The GOHMS GIS project will include aspects of island environments that can be used to facilitate environmental restoration projects in the future. The Pribilof archipelago, located in the Bering Sea, represents our initial attempt in the development of a GIS project on remote islands.
Project Background
The senior author first considered applying Geographic Information System (GIS) technology at the industrial chemical and radioactive wastes sites in Massachusetts Bay. The consideration was sparked by a need to facilitate communications within the federal government, between federal and state governments, and with the public. For nearly two decades, the public demanded to understand the threat posed by radioactive and chemical wastes disposed in Massachusetts Bay. Licensed and permitted disposal between 1946 and 1959 occurred somewhere between approximately six and twenty miles seaward of the City of Boston. No one was absolutely certain where disposal occurred because of the lack of stringent permitting and monitoring requirements. Adequate explanations were made more difficult by the lack of detailed and readily available information on the quantity and types of wastes. Site locations of permitted waste disposal were established with the technology of the day. However, from our current perspective and experience these locations are inadequate to satisfy the current environmental and regulatory questions. In 1997, a major collaboration was begun to compile a Massachusetts Bay GIS project that was completed in 1999 (Butman and Lindsay, 1999). During this time period, a similar need arose for other offshore sites, such as the Farallon Islands Radioactive Waste Disposal Sites (ca. 50 miles west of San Francisco Bay), and several sunken oil and mine product ships. As a consequence, the authors envisioned a greater need for ready access to obscure information on offshore waste sites, and so began the Global Offshore Hazardous Materials Sites (GOHMS) GIS project. The GOHMS GIS project is compiling electronic data and creating coverages on boundaries, habitats, protected areas (e.g. marine sanctuaries and reserves), bathymetry, multibeam records, sidescan records, marine biota, sediments and water in relation to hazardous materials releases (Figure 1).

).
GIS Application at a Remote Island Site: Pribilof Project
In 1999, the senior author became Project Manager for the Pribilof Islands Environmental Restoration Project. This two-island project within a five island archipelago involving more than forty debris and petroleum contaminated soil waste sites and unpermitted landfills, was considered an appropriate tangent to the offshore GIS project.
Site Background
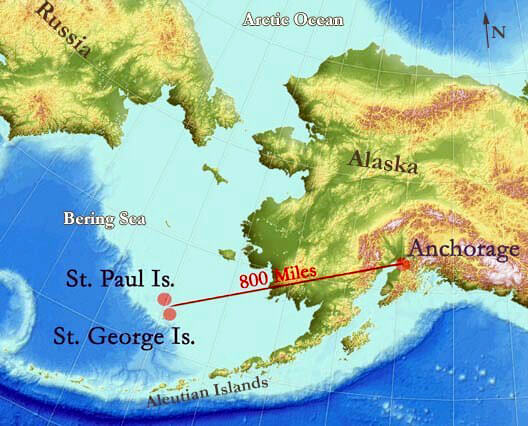
The Pribilof Islands, volcanic in origin and remotely located in the Bering Sea, are the breeding grounds to more than 80% of the world’s northern fur seal population (Figure 2).

). NOAA as the most recent of the former land managing federal agencies for these islands assumed the responsibility to restore the islands’ environmental integrity following decades of solid waste disposal and diesel fuel releases through much of 20th century. More than forty sites on two islands, St. George and St. Paul, require restoration. The islands are approximately 35 and 44 square miles in area, respectively. The restoration project requires hundreds of soil and groundwater samples to evaluate the vertical and horizontal extent of contamination. Tons of buried debris continuously becomes exposed by soil erosion and underground storage tanks require removal. Paper records of debris removal activity are inadequate for managing chronic instances of debris exposure in areas once thought clean. In the tundra environment the paucity of landmarks precludes reliance on readily definable site boundaries. Harsh environmental conditions and unrestricted site access makes the placement of location markers, such as survey flags and shallow benchmark monuments unreliable for future site resurveying. The project team decided that the use of DGPS would be the most economical and easiest method to (1) map site boundaries, sample locations, debris fields, and significant landmarks, and (2) to enable navigation back to specific locations of interest for confirmation sampling and closure. An appropriate island base map must be selected prior to placing sample sites, site boundaries, contaminant data and natural resource information on a map.
Base Map Selection
A base map is required for any GIS project. The map must be geo-referenced and projected in a format that displays the area of interest with little distortion and at a scale of sufficient resolution to allow meaningful presentation. Geo-referenced base maps are normally available from numerous sources such as U.S.G.S topographic quadrangles, NOAA nautical navigation charts, and orthorectified aerial photomosaics.
Alaska and its’ Pribilof Islands present challenges for the application of GIS that are uncommon concerns at least in the lower 48. First, Alaska is geologically dynamic with some regions experiencing horizontal tectonic movements of as much as two centimeters per year. According to NOAA hydrographic and benchmark experts, vertical shifts are more dynamic. This geologic activity, by itself, makes precision geo-referencing quite challenging even if the base map was created within the past five years.

The Pribilof Islands have had three traditional base maps created. The first map is a USGS topographic quadrangle (TAK 2188) mapped in 1947 at a scale of 1:250,000. Although it has been updated as recently as 1992, the number of corrections applied has decidedly increased inherent geo-referencing error associated with each correction. Among other dynamic influences these corrections did not consider tectonic shifts. The second map is a US Department of Agriculture, Natural Resource Conservation vegetative cover map produced at a scale of 1:250,000, which is also too coarse for accurate shoreline delineation. The third set of possible base maps are the NOS nautical navigation charts (Figure 3). The Pribilof Islands were surveyed at a scale of 1:25,000 using international standards that tolerate an error of 1 mm to the scale of the survey. The digital raster charts created from these navigation charts have errors on the order of plus/minus 25 meters. The scale of projection, however, is at 1:50,000, which again is coarse for precision shoreline positioning.
Site Locational Data
Once a base map is selected, site specific locational data can be gathered for layering over the base map. Locational data can be gathered with either conventional survey techniques or with GPS. Geo-referencing typically relies on either benchmarks or control points that are surveyed in at some known level of accuracy, such as plus or minus 1 cm, 1 m or 10 m. National Geodetic Survey (NGS) benchmarks are among the most reliable as they are surveyed in under strict controls. Unlike conventional surveying that relies solely on the benchmark, GPS also relies on satellite signals. Until recently satellite signals were intentionally mixed to reduce accuracy by a process called “dithering”; due to “dithering” GPS measures of accuracy were at best 95 m, 95% of the time. “Dithering” termed “Selective Availability” by the U.S. Department of Defense, which manages the system; was the greatest source of error in GPS systems. Selective availability was turned off in May 2000, improving real time GPS accuracy to approximately 10 – 30 meters. More precise locational positions to subcentimeter can be acquired with DGPS. Even without “dithering” satellite signals are effected by other factors such as atmospheric distortions. Therefore the signals transmitted from a constellation of satellites must be corrected in order to achieve submeter accuracy. Signals stored by DGPS beacons automatically make such corrections using internal computer algorithms.
On the Pribilofs, no DGPS beacons are accessible. The closest DGPS beacon sits in Cold Bay, Alaska, more than 250 miles from the Pribilof Islands, and beyond reliable receiver signal range. As a normal alternative, a DGPS surveyor may either setup a beacon at a surveyed benchmark, or purchase satellite corrected signals from any one of several satellite service companies. Using either of these approaches, the surveyor roams about the field with a DGPS rover unit that gathers the satellite signals at a point of interest. If the surveyor set up a beacon, then the signals gathered by the DGPS rover unit must be compared to signals gathered by the beacon through a complicated, software driven postprocessing routine. Raw data files from the satellites are gathered by DGPS receivers in the geographic coordinates, (decimal degrees) referenced to the World Geodetic Survey (WGS) 84 datum. These data are then converted to an appropriate projection such as the chosen project specific UTM, WGS84.
The Pribilof Islands posed what proved to be unexpected and difficult problems. First, the commercial services that transmit corrected DGPS data to base station units do not cover the latitudes above 56( N or the Pribilof Islands (Latitude 57( N). Secondly, only St. Paul Island has NGS quality benchmarks, (second order or higher), all but one monument has been destroyed by on-island developments.
Datum Influences
The various available Pribilof Island base maps were not constructed using a single, global datum, but rather they made use of a variety of datums. The USGS topographic quadrangle (N5624-W16900/60X120) was created in 1948 (revised in 1972) using the local St. Paul and St. George Island topography from a 1:75,000 chart compiled in 1898 and datums of 1944. The NOAA nautical charts originally applied NAD (North American datum) 27, but were later converted to NAD 83. Since WGS 84 is a global datum and is virtually the same as NAD 83 in most applications, the Pribilof project team chose to convert all base maps and gather all field data in geographic coordinates (latitude/longitude), WGS 84 datum. The data could then be projected to other coordinate systems (UTM, etc.) as appropriate.

Differences among datums can yield problems during GIS project construction. In the Pribilof example, source data were provided in a variety of datums: NAD 27, St. Paul 1944, St. George 1944, NAD 83, WGS 72, and WGS 84. The positions of numerous landmarks, such as the NGS benchmarks and BLM land ownership maps, when re-entered into the GIS project files in NAD 83 or WGS 84 plotted correctly on the 1: 50,000 NOS digital chart, the highest resolution base map available. But unfortunately, all the data provided by the project’s DGPS unit showed inconsistent shifts off the base map. These shifts were generally 160 – 180 meters to the southwest of the expected position. During attempts to reconcile the shifting problem, investigators plotted published records of the U.S. Coast Guard Loran-C tower and two fixed, lighted navigational aides in the harbor on St. Paul. These points plotted approximately 180 meters to the southwest of the position indicated on the NOS navigational chart. (Figure 4). This variation from the published positions is generally consistent with the offset between the DGPS data collected in the field and the associated features depicted on the NOS digital chart. In part, the scale of the map is too coarse to enable more accurate estimates of the shift. The authors believe that these irregularities are the result of datum shift and re-calibration of benchmark locations (see Temporal Issues below).
Scale

Considerations of scale are important in any mapping situation, and are particularly important in a remote island location such as the Pribilofs. Since basemaps are limited in number and of varying quality, their use in the mapping of waste sites and restoration activities has been problematic. DGPS is capable of providing site-specific data to sub-meter accuracy. Since most of the sites on the Pribilofs measure only a few hundred square meters, and our acquired DGPS positions are quite precise relative to each other, our data can be applied to create detailed site maps (Figure 5), even though adequate island base maps are wanting. Our scale problem relates to map accuracy. In other words, project DGPS sample locations while precise in their spatial relationships on a large site map scale, do not plot accurately on smaller scale base maps. The Pribilof’s lack the medium to large scale (for example 1:24,000 to 1:5,000) base maps thereby making it difficult to accurately map small sites relative to each other, or in relation to topographic features or other landmarks. The wide difference in scale between the base maps and site maps developed from DGPS data makes reliance on DGPS more critical for site mapping and navigation back to the waste site and sample locations.
Temporal Issues
In addition to the various spatial factors, temporal concerns are of particular importance in the Pribilof Islands. In the harsh environment and relatively featureless landscape, few permanent landmarks exist. Storms, persistent winds and human activity erode topographic features such as shorelines, bluffs and dunes. Roads are unpaved and routinely plowed, resulting in some spatial changes over time. The harsh winter weather and rapid growth of tundra grasses in the spring can make recovery of site markers nearly impossible from one season to the next. In addition, the locations of some sites are virtually unknown, save general descriptions from written reports and the recollections often 40 or more years old by local individuals. The precise location of such sites after the passage of several years or decades is difficult to say.
Finally, the great difference in time periods, and thus the technologies used, of the available base maps creates problems. Maps made in different time periods, to differing standards, are not easily combined. In the Pribilofs, this is evident in a unique situation. As mentioned earlier, the NOAA nautical chart has been generally accepted as the most accurate and usable base map of the islands. Recent investigation by the authors, together with recognized geodetic and charting experts, has found that the nautical chart and the geodetic control for the islands were done independently, and not to the same schedule of positional corrections. The NGS geodetic control points and the NOAA nautical charts were converted from NAD 27 to NAD 83 in 1986, using standard conversion routines. However, it appears that subsequent updates to NGS geodetic control points were done (on a few stations only), without corresponding updates to the NOS digital nautical charts. The result is that there exist three sets of coordinates for the primary (second order) reference station on the island. DGPS data corrected to the earliest of the reference coordinates appears to plot the most accurately on the NOS digital chart, while those corrected to the more recent (and presumably more accurate) reference positions show a consistent offset from the chart. Further research is continuing, in an attempt determine the exact causes of such discrepancies and the resultant offsets between the DGPS field data and the NOS digital charts.
Navigating Back to Points
Regardless of having an adequate electronic base map, the DGPS unit should be enable relatively rapid and accurate navigation back to points of interest. However lacking real-time correction broadcasts from satellites or beacons, DGPS navigation must rely on alternative techniques. For example, the DGPS rover unit operator can go to a site and gather signals at several locations in the area of interest. These new site points must be marked with field flags or something similar. The operator then must return to a base station located at a benchmark and postprocess signal data gathered by the rover unit and base station. The post-processed data provides corrected coordinates for those points flagged earlier in the day. The operator then returns to the site and triangulates to the coordinates associated with points gathered the previous year, for example. Alternatively, a base station is setup at a benchmark and a radio configured to the base station that transmits a precise signal to a rover unit configured with a receiver. If the rover unit is out base station’s radio range, a signal repeater must be installed.
Correcting Pribilof Island Navigation
In March of 2000, the project located three new 1st order NGS benchmarks on each island. Previously, St. George Island had no benchmarks of sufficient quality, and St. Paul had only one “B” order benchmark last surveyed in 1996. One bench mark was placed at a government building on each island to serve as a base station. The base stations were placed at buildings to obviate reliance on batteries for power supply. A radio was connected to each base station, and the radio antenna was surveyed in to ensure the accuracy of source coordinates. This approach will limit the need for post-processing rover unit data, as well as allow for navigating back to points of interest. Results of the March 2000 survey and the associated geodetic resolutions showed that the NOS charts were incorrect by approximately 172 meters for St. Paul, and 180 meters for St. George. Once corrections are completed on the NOS chart and other existing maps, DGPS should provide for accurate mapping of project related data.
GIS in support of Remediation (PCS)
Various sites on both St. George and St. Paul Islands, were previously operated by the National Oceanic and Atmospheric Administration (NOAA), or predecessor organizations. Under a Two-Party Agreement (TPA) with the Alaska Department of Environmental Conservation (ADEC), NOAA will complete environmental remedial and restoration actions on both islands and obtain closure of sites. Remedial actions to be addressed include site assessment, debris removal, and petroleum contaminated soils (PCS) remediation at approximately 15 sites, confirmation sampling, restoration and site closure.
To support the remediation and restoration of the many sites on the Islands, NOAA is employing GIS technology. A GIS of all site features including boundaries, contaminants and extent of contaminants, historic sampling locations and results, as well as environmentally sensitive species and habitat locations and populations are being created to support both the clean up of contaminants and the on-going protection of these valuable resources. For the Remediation Phase there are three primary components to the use of GIS.
1) Detailed mapping/site recovery. As described above, historical mapping efforts have been spotty at best, and have generally been small scale. Though several site specific studies have been done, most mapping has been based on engineering principles and not referenced to any real world geographic coordinate system. GIS, coupled with modern GPS technology, allow the detailed mapping of a variety of features with a precision not possible just a few years ago. Field personnel can, with a minimum of training, provide accurate, precise, detailed data about natural features, site boundaries, sample and debris locations, and additional ancillary information in a format easily integrated into the comprehensive GIS database.
The Pribilof Island Project makes use of sub-meter GPS, and ArcView GIS to produce detailed geospatial datasets for each of the sites of concern on the islands. A large amount of spatial and attribute data is being combined with digital photo documentation (both still and video), locational references, and text descriptions. These data are made easily accessible to outside users and project staff alike through customized user interfaces created using ArcView and its extensions. These tools allow field engineers and policy decisionmakers to have access to the widest variety of information possible, in near real time, on a project taking place in a remote island location with a harsh weather environment. Since the ArcView project is used on-island on portable laptop computers, the GIS database can be updated daily with field data. These tools allow field staff to examine a variety of complex data in a simple, intuitive format. Further, they are able to revisit sites with a high level of accuracy and confidence from season to season.
2) Sample Design and Contaminant Assessment. Contaminant interpolation and mass/volume calculations will direct the remediation, confirmation sampling and site closure. Due to the remote location and short field season (5 months) of the Pribilof Islands, efficiency and speed are of primary concern to the remediation effort. Sampling must be done in a well thought out and cost-effective manner. GIS provides tools which facilitate efficient and informed sample design, and enable investigators to estimate the extent and magnitude of contamination with a minimum investment of time, effort, and environmental disturbance. This project makes use of a suite of tools for ArcView GIS provided by EPA’s FIELDS system (Fully Integrated Environmental Location Decision Support). FIELDS provides a variety of tools for sample design, surface interpolation, contaminant hotspot delineation, mass and volume calculation, spatial statistical analysis, and database management; all of which work seamlessly with ArcView GIS. This allows investigators in the field to adapt quickly to changing conditions and create a variety of “what if” scenarios to aid in their day to day decisionmaking. The combination of such powerful GIS tools with established protocols for environmental assessment and cleanup makes this set of ArcView Extensions valuable for remediation in such a remote island environment.
3) Archiving/recordkeeping (Photos, Video, Attribute data) Record keeping of remediation and restoration activities on the Pribilof Islands has in the past been inconsistent at best, and non-existent at worst. A number of remedial actions, site assessments, mapping activities, and documentation efforts have taken place. The results of these activities have been archived in a variety of formats. Most are in hard copy form; either printed copy or emulsion photography. These records are stored in a variety of places, and no comprehensive index exists. In the present Information Age, there is a need to assemble the vast array of historical data with more recently gathered data in an easily accessible and organized manner. GIS provides a powerful set of tools for addressing such a need.
Taking advantage of the flexibility and customizability of ArcView, this project is integrating a variety of historical records with more recent data and documentation. The GIS database includes “hotlinks” to text, still and video photography (including sound), tabular and graphic data presentation, and web sites. The interface is being customized to allow users to switch between historical and recent data and maps easily and interactively. The combination of information of different types and time periods provides perspective and the ability to understand the history of activities related to the sites of concern. The multimedia approach makes the GIS useful for a variety of management, documentation, and educational purposes.
Conclusions
In the marine and terrestrial environments there are many needs to compile and logically present large current and historic data sets gathered with multiple technologies providing a range continuum of resolution. GIS has the ability to integrate and display electronic data collected by a wide diversity of acoustical and optical advanced technologies in a single format. Consequently, GIS is a powerful tool for use in planning, monitoring, archiving and communicating investigations and cleanup activities at logistically remote offshore underwater sites and remote islands. However, since GIS relies on accurate georeferenced data, one cannot presuppose that remote locations have been either properly mapped or charted even in the recent past. Recent applications of GIS at underwater and remote island sites shows that acquisition of submeter geo-referenced positions remains one of the greatest challenges in these settings. And that appropriately scaled and geo-referenced base maps are not necessarily readily available. The Massachusetts Bay and Pribilof Island GIS projects illustrate these challenges. Discrepancies among datums, the limited accuracy of tools and field techniques, and human error can singly or combine to produce erroneous locations by a hundred meters or more. Investigators can ill afford to underestimate the influence of remoteness on the application of GIS project utility.
If such challenges can be overcome however, Desktop GIS can prove an invaluable tool for supporting environmental investigation and remediation at remote island sites. The portability of modern ArcView GIS projects and powerful analytical and decision support tools such as FIELDS allow investigators and field personnel access to a wide variety of data and historical information in near-real time, enhancing the efficiency and effectiveness of the remediation effort.
References
Butman, Bradford and John A. Lindsay (editors). 1999. A Marine GIS Library for Massachusetts Bay: with a focus on disposal sites, contaminated sediments, and sea floor mapping. CD-ROM. USGS Open File Report 99-439.
Lindsay, John A., George Graettinger, Tom Simon, and Gail Pope. 1999a. Mapping a Range Continuum of Resolution at Offshore Hazardous Waste Sites. Extended Abstract In Proceedings of Coastal Zone ’99 Conference, San Diego, CA. 27 July 1999
Lindsay, John A., Tom Simon, George Graettinger, and Craig Bailey. 1999b. A Global Offshore Hazardous Materials Sites GIS (GOHMS-GIS). Extended Abstract. In Proceedings of Coastal Zone ’99 Conference, San Diego, CA. 27 July 1999.
John A. Lindsay
Pribilof Island Project Manager
7600 Sand Point Way N, Seattle, WA 98115
(206) 526-4560 E-mail: John.Lindsay@NOAA.gov
Thomas J. Simon
GIS Specialist
7600 Sand Point Way N, Seattle, WA 98115
(206) 526-4640 E-mail: Tom.Simon@NOAA.gov
George D.Graettinger
GIS Coordinator
7600 Sand Point Way N, Seattle, WA 98115
(206) 526-4660 E-mail: George.Graettinger@NOAA.gov